Big Sister Cities: How They Are Related
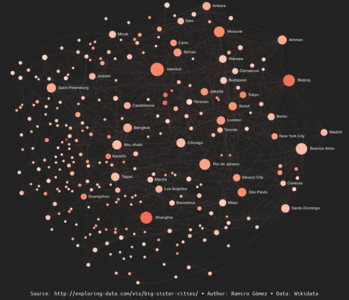
Big Sister Cities is an interactive network graph showing 279 cities with more than 1 million inhabitants and how they are connected to their sister cities within this set. The cities are the nodes which are sized by degree and colored by population and the 852 edges show the sister relations. The data for creating this graph was retrieved from Wikidata in April 2018.
Top 20 cities by number of sister cities
The following list shows the 20 most connected cities within the network. The city name links to the highlighted node in the network, the first number is the count of sister cities and the second the population.
- Chongqing - 77 - 1,039,000
- Istanbul - 71 - 14,657,434
- Beijing - 58 - 21,710,000
- Rio de Janeiro - 53 - 6,476,631
- Shanghai - 53 - 23,390,000
- Buenos Aires - 53 - 2,890,151
- Moscow - 51 - 12,500,123
- Bangkok - 48 - 5,696,409
- Chicago - 42 - 2,722,389
- London - 42 - 8,787,892
- Seoul - 38 - 9,857,426
- Taipei - 38 - 2,684,567
- Amman - 38 - 4,995,000
- Ankara - 37 - 5,270,575
- Santo Domingo - 36 - 2,581,827
- Abu dhabi - 35 - 2,502,715
- Warsaw - 35 - 1,753,977
- São Paulo - 34 - 12,106,920
- Tehran - 33 - 8,846,782
- Jakarta - 32 - 9,769,000
How the graph was created
The data underlying this graph was queried from Wikidata's Query Service in April 2018 using this SPARQL query and transformed to a graph structure in Python, you can find the code in this repository.
I rendered the graph in Gephi using the Force Atlas layout. The node colors represent the population values, the darker the larger the city. The size of the nodes represent the degree, i. e. the number of sister cities within this set of cities. The browser version is rendered with the JavaScript library sigma.js.
Published on April 26, 2018 (updated on January 31, 2026) by Ramiro Gómez. To be informed of new posts, subscribe to the RSS feed.
Tags: network graph, sigmajs, cities, networkx, diplomacy, gephi.
Visualization
 View Visualization
Visualization Poster
 Buy Print
Source Code
Check out the source code used to process the data and create the visualizations.
Code Repository