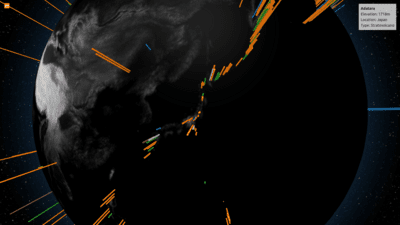
Volcanoes of Planet Earth
A 3D globe showing a selection of volcanoes on planet earth.
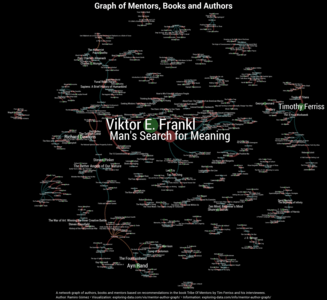
Graph of Mentors, Books and Authors
An interactive network graph consisting of authors, books and mentors based on recommendations...
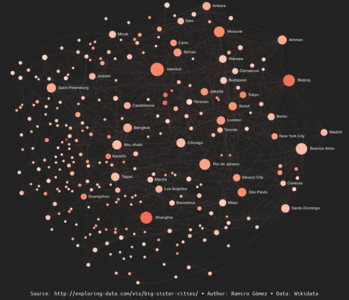
Graph of Big Sister Cities With +1 Million Inhabitants
An interactive network graph showing 279 cities with more than 1 million inhabitants and how...
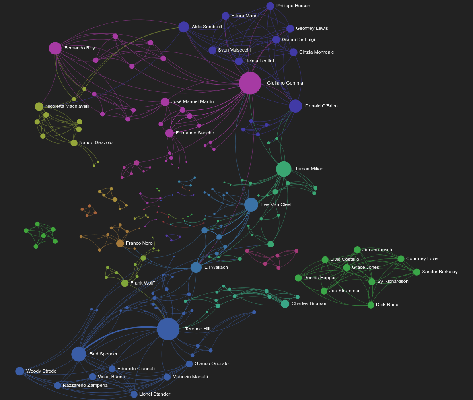
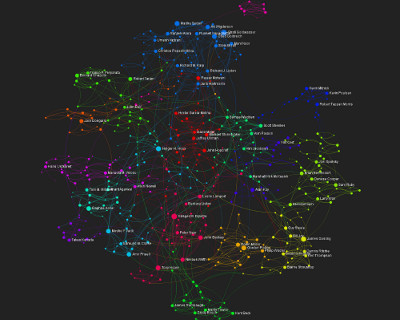
Spaghetti Western Actors Network Graph DBpedia
This is an undirected graph of co-occurrences of actors who appeared in one or more Spaghetti...

How Much Cristiano Ronaldo Earns Viewed from 2 Angles
A look at how much Cristiano Ronaldo earned in 2013/14 compared to the average wage in Spain and...
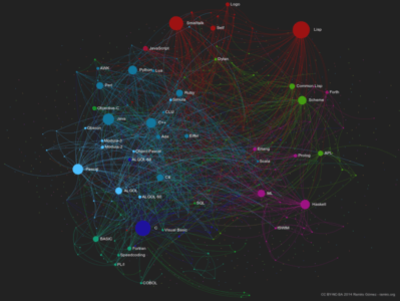
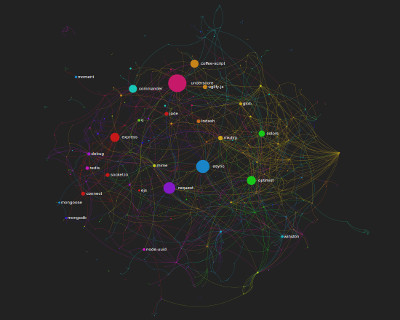
Programming Languages Influence Network 2014
An interactive network graph showing the connections of programming languages based on their...
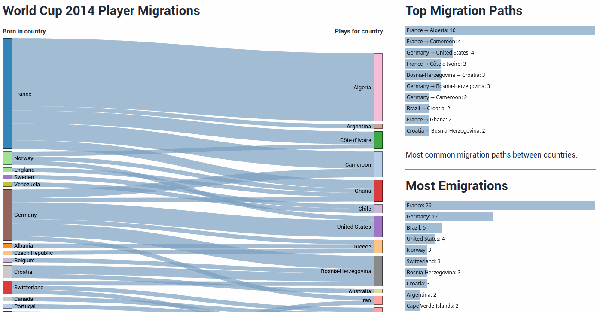
World Cup 2014 Player Migrations
An interactive data visualization that shows the migration paths from players participating in...
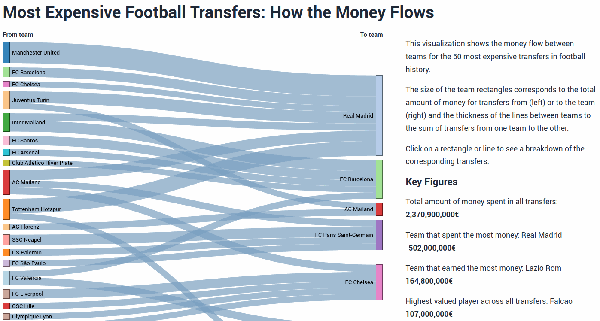
Most Expensive Football Transfers: How the Money Flows
An interactive visualization that shows the money flow between teams for the 50 most expensive...
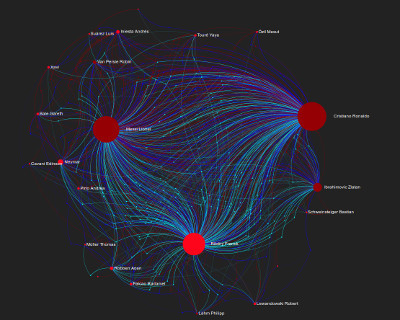
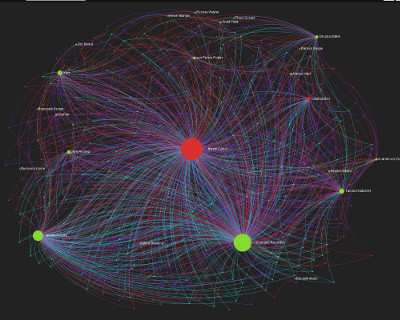
Ballon d'Or 2013 Male Players Votes Network
An interactive network graph showing the connections between voters and voted male football...
npm Top Packages Dependencies Graph
An interactive network graph showing the dependencies between npm packages, with at least 10...
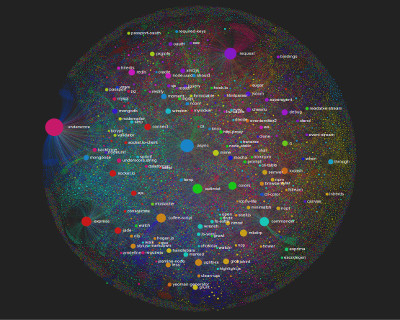
npm Packages Dependencies Graph
An interactive network graph showing the dependencies between npm packages as of July 12, 2013...
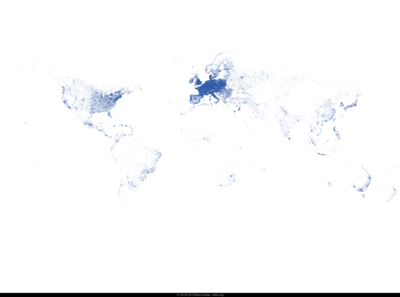
Geo Maps Drawn from IP Locations
Geographic maps of the world and most continents drawn based on an IP location dataset with...
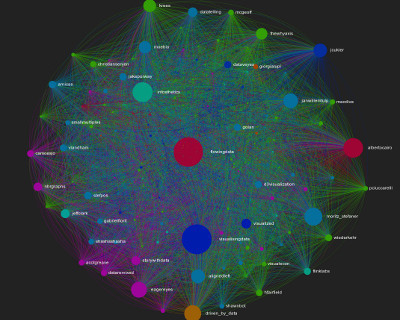
Visualisingdata Census Twitter Network
An interactive network graph showing the connections of Twitter users who participated in the...
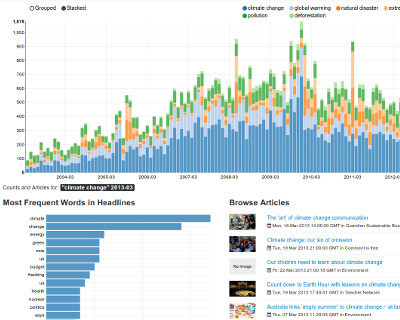
A Decade of Climate Change in the Guardian
Explore a decade of climate change, global warming, natural disaster, extreme weather, pollution...

Footballers Search Relations Network
An interactive network graph showing the relations of footballers based on Google searches as...
Programmers Search Relations Network
An interactive network graph showing the relations of programmers based on Google searches as...
Ballon d'Or 2012 Votes Network
An interactive network graph showing the connections between voters and voted players from the...
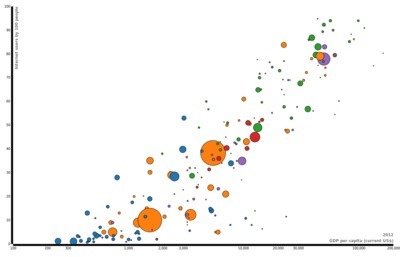
Evolution of Internet Users from 1990 - 2012
An animated scatterplot showing the evolution of Internet users across the worlds countries from...
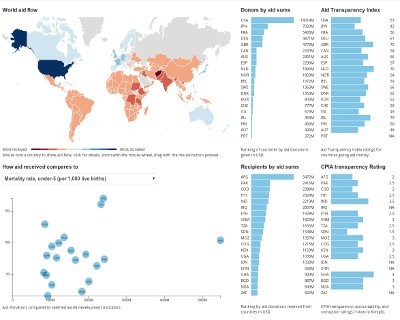
World Aid Flow, Transparency, Development
An interactive visualization looking at world aid flow, aid transparency, and development in...
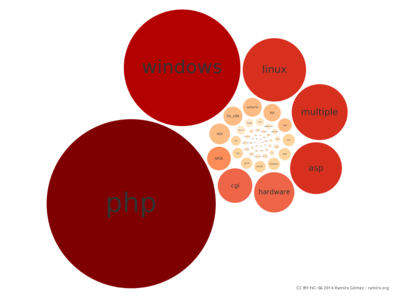
Which Software Platforms are Exploited the Most
A pack layout visualization of platforms sized by the number of exploits created with the...
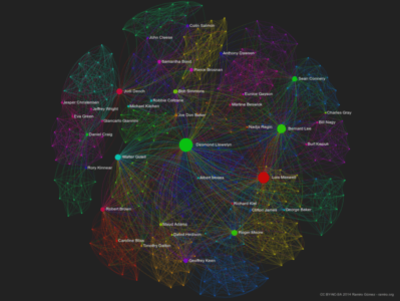
James Bond Actors Network
An interactive network graph showing the connections of actors that appeared together in 23...
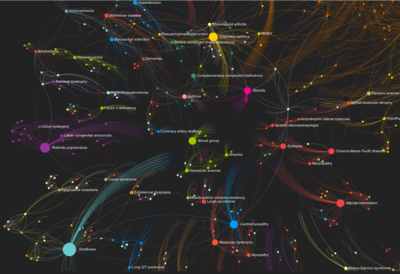
Human Disease Network
An interactive network of disorders and disease genes linked by known disorder–gene associations...
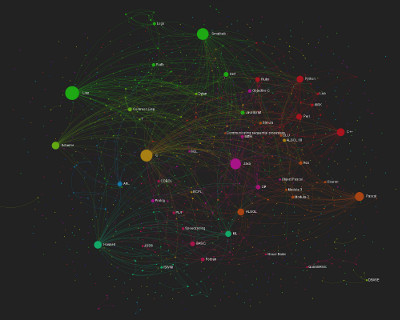
Programming Languages Influence Network
An interactive network graph showing the connections of programming languages based on their...

Programming Languages Influence Network D3
An network graph showing the connections of programming languages based on their influences...